
How To Choose A Successful Infographic Concept
- by 7wData
The success of your infographic is determined long before your graphic designer starts working in Illustrator or Photoshop. It’s even settled before your writer starts researching. The true success of an infographic lies in its concept. This is the seed of the infographic, from which everything else follows.
A good execution of that infographic concept matters, obviously. But if you don’t have a strong concept, then it won’t reach its potential. If you want to choose a concept that will boost your business, make sure it satisfies these four criteria.
What exactly do you hope to get out this infographic? Do you want to position yourself as a thought leader? Do you want it to spread through a social media community? Do you want to earn backlinks for SEO?
Before you even think about your concept, get clear on what you want the infographic to achieve.
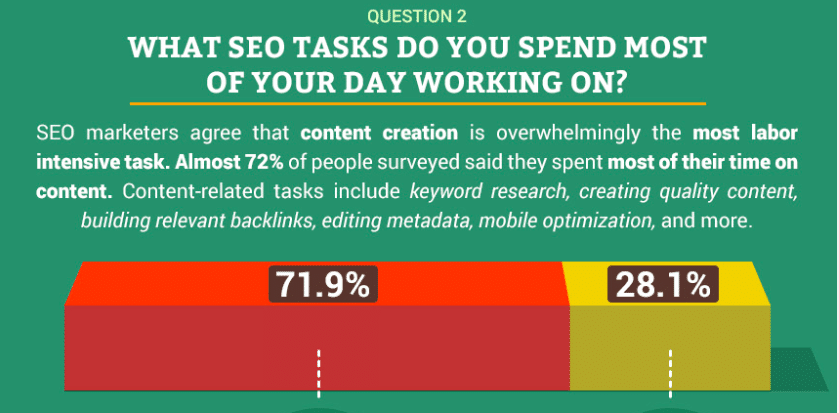
Let’s say you want to position yourself as a thought leader. Your infographic concept might revolve around original research, which you can present through data visualization. For example, check out this infographic from Search Engine Journal about what SEO experts are working on.
That data comes from an original survey of 65 top SEOs. The concept not only gives Search Engine Journal readers useful information, but it also establishes Search Engine Journal as a publication that has its finger on the pulse on the search industry.
An infographic about blues guitarists might be smart if you’re a music store — but it might not be a good idea if you’re a computer repair shop.
An infographic is more than just a pretty way to present information. It’s also a reflection what you value as a business. So it should always connect to the image you want to present to the world. Take for example, this infographic aout the most iconic glass bottles from O Berk.
[Social9_Share class=”s9-widget-wrapper”]
Upcoming Events
From Text to Value: Pairing Text Analytics and Generative AI
21 May 2024
5 PM CET – 6 PM CET
Read More