A data story flow chart: talk to an expert
- by 7wData
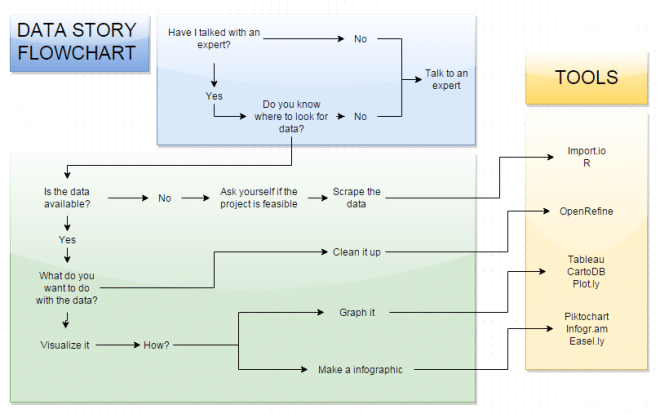
James Gaines has put together an impressively elegant flowchart for data stories.
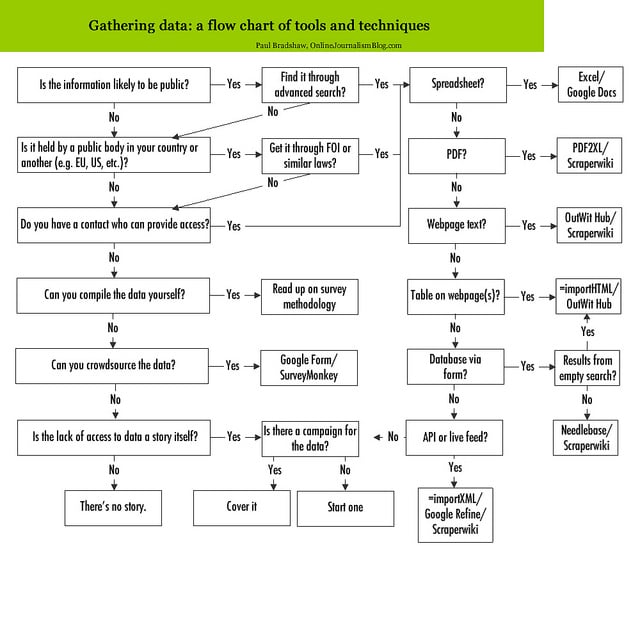
James is coming at this from a science journalism perspective, where expertise is particularly vital, but this applies to other disciplines too. So many times you can find out about, or get to, data through simply talking to someone who deals with it, rather than going through FOI or spending hours on searches. It also connects nicely with my own flowchart on finding data to which you can now add Import.io as James does, plus Kimono.
[Social9_Share class=”s9-widget-wrapper”]
Upcoming Events
Shift Difficult Problems Left with Graph Analysis on Streaming Data
29 April 2024
12 PM ET – 1 PM ET
Read MoreCategories
You Might Be Interested In
Army researcher invents new ways for intelligence analysts to visualize, interact with information
10 Jul, 2015Army researchers are improving how computers manage a myriad of images, which will help analysts across the DOD intelligence …
Using Data Visualization to Get What You Want
21 Jan, 2016When your boss keeps saying “no” to options you know would be great for business, your presentation is probably the …
8 Great Examples of Complex Data Visualized
2 Oct, 2015Visuals are a powerful way to convey messages, present information, and persuade audiences. Following stats show the power of visuals: The brain …
Recent Jobs
Do You Want to Share Your Story?
Bring your insights on Data, Visualization, Innovation or Business Agility to our community. Let them learn from your experience.