

Georgia State University created a technology-rich visualization space that supports Research and instruction and explores the transformative potential of visual media across all disciplines.
In September 2014, Georgia State University officially opened CURVE — the Collaborative University Research & Visualization Environment — a cutting-edge visualization space that showcases the potential of visual media and makes the use of high-end visualization technology more commonplace for both research and instruction on campus.
Working together, university units contributed $1.2 million to transform an entire 3,300-square-foot floor of the university library, giving CURVE a central home on campus and sending a clear message that the technology is there for everyone to use. Glass walls surrounding the space allow passers-by to see large-scale visualizations occurring every day. Prominently showcasing the technology provides the initial, brief glimpses that will turn into regular, hands-on familiarity for many researchers, students, faculty and staff at Georgia State.
CURVE's prominent location in the university library sends a clear message that the technology is there for everyone to use. (photo courtesy of Georgia State University)
The centerpiece of CURVE is the "interactWall," a touch-enabled, 24-foot-wide interactive video wall. Designed for collaborative, data-rich visual interactions, the interactWall is powered by CineNet Collaborative Visualization Software and the Alpha Video Wall Processor and Controller from CineMassive. The technology is used not only for big data research, but for instruction that leverages dynamic data explorations.
Adjacent to the video wall are small-group collaboration stations, including advanced 4K workstations as well as high-end PCs and Mac Pro computers set up to manipulate large images and data sets. Among the workstations are two particularly powerful Dell Precision T5610 towers, each with a 4GB NVIDIA Quadro K5000 GPU. A modular room layout can accommodate a variety of collaborative group configurations, so multiple groups can work together on a research question.
CURVE is setting a new precedent for access to visual media technologies at Georgia State. Students, faculty and staff can use visualization and modeling software, high-end graphics processors and immersive large-scale displays; some employ specialty software packages for quantitative, qualitative and spatial data analysis, and for others, the latest geospatial and visualization tools support simulations in their field of study. And with the growing emphasis of analytics, data visualization, GIS and digital scholarship in all fields, CURVE is fostering new interdisciplinary connections and research collaborations among previously disparate groups.
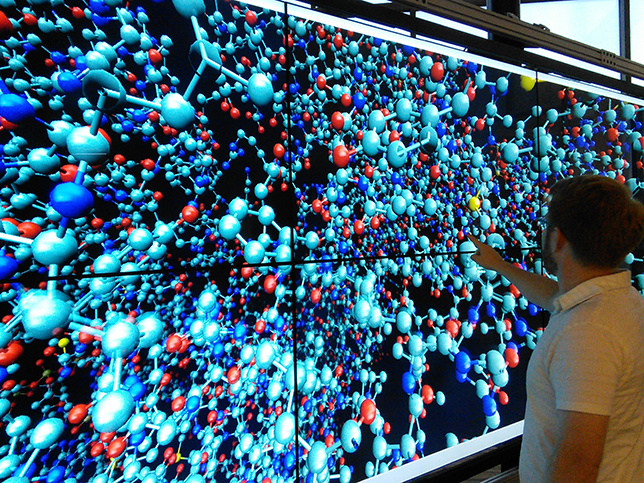
During the few short months since CURVE's grand opening in September, several new interdisciplinary projects have been developed using CURVE resources, in diverse areas such as community geography; 3D molecular models; 3D visualizations in archaeology; DNA damage on the molecular level; and urban gardening and food deserts. More and more, CURVE is enabling real-world research projects, in which students — including undergraduates — are often key participants.
Longer-term, the promise of CURVE may be an increasingly clearer understanding of visual media and information technology that Georgia State can share with the world. Project lead Bryan Sinclair, associate dean of the university library, commented on the impact he hopes the facility will have: "We are only at the very earliest beginning of understanding how data visualization, virtual reality, augmented reality and other visual media will transform how we understand and interact with the world and each other. CURVE is unique in that it represents a partnership between the library, central IT, and institutional leadership to develop a collective understanding of what information technology can deliver."
