
Property Graphs: Training Wheels on the way to Knowledge Graphs
- by 7wData
I’m at a graph conference. The general sense is that property graphs are much easier to get started with than Knowledge Graphs. I wanted to explore why that is, and whether it is a good thing.
It’s a bit of a puzzle to us, we’ve been using RDF and the Semantic Web stack for almost two decades, and it seems intuitive, but talking to people new to graph databases there is a strong preference to property graphs (at this point primarily Neo4J and TigerGraph, but there are others).
A knowledge graph is a database that stores information as digraphs (directed graphs, which are just a link between two nodes).
The nodes self-assemble (if they have the same value) into a completer and more interesting graph.
What makes a graph a “property graph” (also called a “labeled property graph”) is the ability to have values on the edges
Either type of graph can have values on the nodes, in a Knowledge Graph they are done with a special kind of edge called a “datatype Property.”
Here is an example of one of the typical uses for values on the edges (the date the edge was established). As it turns out this canonical example isn’t a very good example, in most databases, graph or otherwise, a purchase would be a node with many other complex relationships.
The better use of dates on the edges in property graphs are where there is what we call a “durable temporal relation.” There are some relationships that exist for a long time, but not forever, and depending on the domain are often modeled as edges with effective start and end dates (ownership, residence, membership are examples of durable temporal relations that map well to dates on the edges)
The other big use case for values on the edges which we’ll cover below.
Talking to people and reading white papers, it seems the appeal of Property Graph data bases are in these areas:
The primary interfaces to Property Graphs are json style APis, which developers are comfortable with and find easy to adapt to.
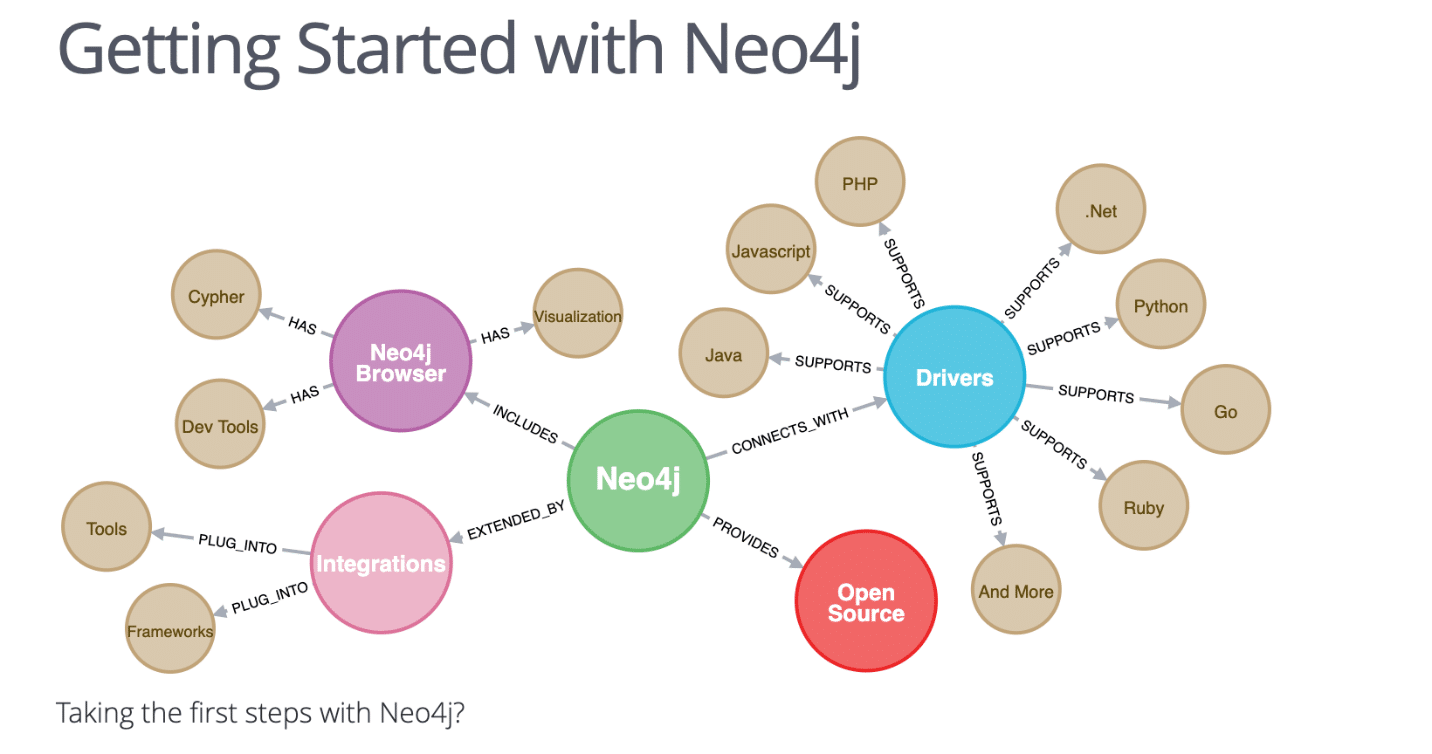
Neo4J in particular have done a very good job of getting people set up and running and productive in short order. There are free versions to get started with, and well exercised data sets to get up and going rapidly. This is very satisfying for people getting started.
One of the striking things about Neo4J is their beautiful graphics
You can rapidly get graphics that often have never been seen in traditional systems, and this draws in the attention of sponsors.
Perhaps the main distinction between Property Graphs and RDF Graphs is the ability to add attributes to the edges in the network. In this case the attribute is a rating (this isn’t a great example, but it was the best one I could find easily).
One of the primary use cases for attributes on the edges would be weights that are used in the evaluation of network analytics. For instance, a network representation of how to get from one town to another, might include a number of alternate sub routes through different towns or intersections. Each edge would represent a segment of a possible journey. By putting weights on each edge that represented distance, a network algorithm could calculate the shortest path between two towns. By putting weights on the edges that represent average travel time, a network algorithm could calculate the route that would take the least time.
Other use cases for attributes on the edges include temporal information (when did this edge become true, and when was is no longer true), certainty (you can rate the degree of confidence you have in a given link and in some cases only consider links that are > some certainly value), and popularity (you could implement the page rank algorithm with weights on the edges, but I think it might be more appropriate to put the weights on the nodes)
There are a wide range of network analytics that come out of the box and are enabled in the property graph.
[Social9_Share class=”s9-widget-wrapper”]
Upcoming Events
From Text to Value: Pairing Text Analytics and Generative AI
21 May 2024
5 PM CET – 6 PM CET
Read More