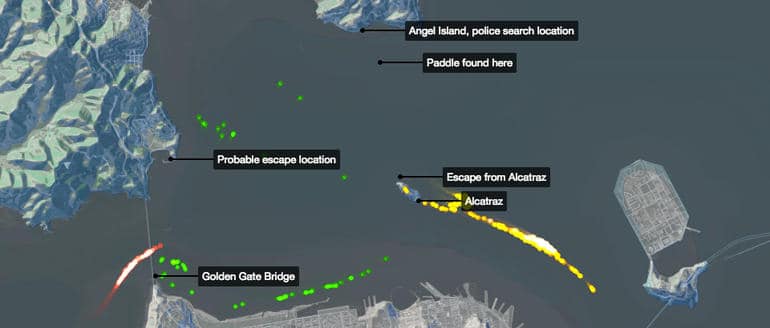
CartoDB: From Alcatraz to elephants, startup puts open source visualisation on the map


Sometimes, creating a successful business isn't just a matter of having a good idea. Sometimes, what you really need is luck.

Javier de la Torre and Sergio Álvarez Leiva certainly had luck when they published the right material at the right time.

In 2007, they started working together on a data visualization project involving conservation and biodiversity. They both like science and were curious to know how protected areas help conserve endangered species, so they took public data from different UN agencies, analyzed it, and published the results in a blog entitled Biodivertido. As luck would have it, the United Nations saw the result, contacted them to say it had long wanted to do something similar - and said it wanted to hire them.

They created software to process millions of data points and display the results on a map to help better understand a problem or tell a story. Thus Vizzuality - their company - and CartoDB - its flagship product - were born, thanks to bootstrapping, some public funding, and hard work.

Think big data is too big for SMEs? Barcelona's out to prove you wrong

The company cofounder recognizes that "seeking funding makes you realize the issues at hand".

Share it:
Share it:

[Social9_Share class=”s9-widget-wrapper”]

Leave a Reply

Your email address will not be published. Required fields are marked *

This site uses Akismet to reduce spam. Learn how your comment data is processed.

You Might Be Interested In

How to use data to create strong visuals

4 Jan, 2016

Matt Cooper, CEO, Visually: The key best practice here is to use every part of the buffalo. If you create …

Read more

Exploring High-End Visualization for Research and Education

24 Jul, 2015

  Georgia State University created a technology-rich visualization space that supports research and instruction and explores the transformative potential of …

Read more

A data story flow chart: talk to an expert

6 Jun, 2015

  James Gaines has put together an impressively elegant flowchart for data stories. James is coming at this from a …

Read more

Recent Jobs

IT Engineer

Washington D.C., DC, USA

1 May, 2024

Read More

Data Engineer

Washington D.C., DC, USA

1 May, 2024

Read More

Applications Developer

Washington D.C., DC, USA

1 May, 2024

Read More

D365 Business Analyst

South Bend, IN, USA

22 Apr, 2024

Read More

Do You Want to Share Your Story?

Bring your insights on Data, Visualization, Innovation or Business Agility to our community. Let them learn from your experience.

Get the 3 STEPS

To Drive Analytics Adoption
And manage change

3-steps-to-drive-analytics-adoption

Get Access to Event Discounts

Switch your 7wData account from Subscriber to Event Discount Member by clicking the button below and get access to event discounts. Learn & Grow together with us in a more profitable way!

Get Access to Event Discounts

Create a 7wData account and get access to event discounts. Learn & Grow together with us in a more profitable way!

Don't miss Out!

Stay in touch and receive in depth articles, guides, news & commentary of all things data.