
The 3 Vs of Big Data revisited: Venn diagrams and visualization
- by 7wData
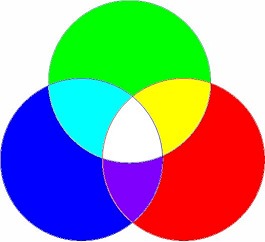
This discussion is about visualization. The three Vs of big data (volume, velocity, variety) or the three skills that make a data scientist (hacking, statistics, domain expertise) are typically visualized using a Venn diagram, representing all the potential 8 combinations through set intersections. In the case of big data, I believe (visualization, veracity, value) are more important than (volume, velocity, variety), but that's another issue. Except that one of my Vs is visualization and all these Venn diagrams are visually wrong: the color at the intersection of two sets should be the blending of both colors of the parent sets, for easy interpretation and easy generalization to 4 or more sets. For instance, if we have three sets A, B, C painted respectively in red, green, blue, the intersection of A and B should be yellow, the intersection of the three should be white.
Here, I'll discuss how to create better diagrams, and then focus on how to add extra dimensions to an existing chart - including not just visual elements, but sound.
If you want to represent 3 sets, you need to choose 3 base colors for the 3 sets, and then the colors for the intersections will be automatically computed using color addition rule. It makes sense to use red, green, blue as the base colors for two reasons:
Actually, you don't even need to use Venn diagrams when using this color scheme: instead you can use 8 non-overlapping rectangles, with the size of each rectangle representing the number of observations in each set / subset. Note that, to the contrary, choosing red, green and yellow as the three base colors would be very bad because the intersection of red and green is yellow, which is also the color of the third set.
If you have 4 sets, and assuming the intensity for each R/G/B component is a number between 0 and 1 (as in the rgb function in the R language), a good set of base colors satisfying the above first property is: {(0.5,0,0), (0,0.5,0), (0,0,0.5), (0.5,0.5,0.5)} corresponding to dark red, dark green, dark blue, grey.
For 5 sets or more, it is better to use a table rather than a diagram, although you can find interesting but very intricate (difficult to read) Venn diagrams on Google.
If you are not familiar with how colors blend, do this exercise: create a rectangle filled in yellow, in your favorite graphic editor. Next to this rectangle, create another rectangle filled with pixels that alternate between red and green: this latter rectangle will appear yellow to your eyes.
[Social9_Share class=”s9-widget-wrapper”]
Upcoming Events
Shift Difficult Problems Left with Graph Analysis on Streaming Data
29 April 2024
12 PM ET – 1 PM ET
Read MoreCategories
You Might Be Interested In
How Smartphone (Big) Data Can Make Healthcare Smarter
7 Sep, 2017I’ve written numerous times about the tremendous possibilities for improving medical research when traditional medical data is combined with the …
How To Start Using Artificial Intelligence In Supply Chain Management
8 May, 2019Supply chains are getting smarter, and not because we as human beings are growing collectively better at predicting when inventory …
Is Big Data making CIOs smarter?
15 Dec, 2016Many claims for big data projects suggest that just collecting the data somehow gives business the insight they need. The …
Recent Jobs

Do You Want to Share Your Story?
Bring your insights on Data, Visualization, Innovation or Business Agility to our community. Let them learn from your experience.
Privacy Overview
Get the 3 STEPS
To Drive Analytics Adoption
And manage change
