
5 Steps for Advanced Data Analysis using Visualization
- by 7wData
In most of the scientific researches, due to large amount of experiment data, statistical analysis is typically done by technical experts in computing and statistics. Unfortunately, these experts are not the experts of underlying research; which may cause gaps in analysis. If actual researchers are given easy to use tools and methods to handle and analyse data, it will enrich the research outcome for sure.
A common challenge affecting many scientists, especially those working in the area of molecular biology, is the vast amount of data that is created by their experiments. With such a large volume of data to consider, software tools are required to interpret their data effectively.
Until now, computer software designed for this purpose has focused on being able to handle increasingly vast amounts of data and to a large extent applying standard statistical methods presented to the user in a technical specialist oriented user interface. As a result, the possibility for the scientist/researcher to approach and interpret data has partly been set aside, and a lot of data analysis can only be performed by specialist bioinformaticians and biostatisticians. In most cases, however, this model has several drawbacks, since it is typically the scientist who knows the most about the specific area being studied.
Visualization in combination with well selected algorithms and methods can overcome some of the described challenges and allow a broader range of users to explore and analyze data. The active use of Visualization techniques provides a powerful way of identifying important structures and patterns very quickly. Visualization provides the user with feedback that is easy to understand. Visualization is also an important tool from an organizational point of view since it stimulates innovation as a result of more scientists now being able to analyze and discuss data and results.
We recommend a five-step method to ensure repeatable and significant results when using Visualization to identify new subgroups and patterns in data. The purposes of this analysis step can be several. The most common purpose is to try to identify completely new groups or patterns in data. Another purpose can be to explore data to detect only expected patterns, which is a good form of quality control. By applying this five-step method, it is possible to investigate large and complex data sets without being an expert in statistics. The method is described below in more detail, but some basics need to be in place at the start. This method can be applied to any type of high dimensional data and examples on data from the life-science industry are; RNA-seq, gene expression arrays, proteomics, DNA methylation, metabolomics.
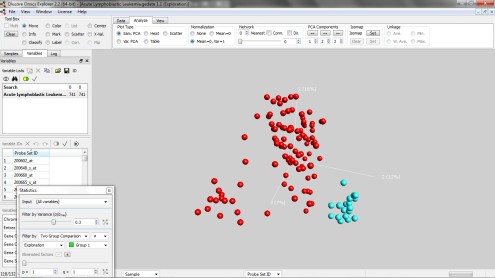
First of all, the high dimensional data needs to be reduced to lower dimensions so that it can be plotted in 3D. We recommend the use of Principal Component Analysis (PCA) for this purpose. Tools to color data to enhance the information are also required, as well as filters and tools to select and deselect parts of the data set.
At this stage, researchers can begin the five-step Visualization process by detecting and removing the strongest signal present in the active dataset. Once this signal is identified, it can be removed in order to see whether there are any other obscured (but still detectable) signals present. Removing a strong signal will usually result in the reduction of both the number of active samples and/or variables(features).
Step two of the process is to assess the signal-to-noise ratio in the data by using PCA, Projection Score and randomization.
[Social9_Share class=”s9-widget-wrapper”]
Upcoming Events
From Text to Value: Pairing Text Analytics and Generative AI
21 May 2024
5 PM CET – 6 PM CET
Read MoreYou Might Be Interested In
Machine learning: From science project to business plan
1 Jan, 20172015 was the year machine learning emerged from the academic closet. No longer was it an esoteric discipline commanded by …
Artificial intelligence: Leveraging machines to dissect ransomware DNA
26 Sep, 2016Ransomware is a big thorn in the side of today’s digital economy. In the United States, victims of ransomware attacks …
The Importance of Data Democratization for the Digital Enterprise
30 Oct, 2016Democratization in business means more transparency and fluidity in the workplace. Formerly defined roles of the subordinate and the executive …
Recent Jobs
Do You Want to Share Your Story?
Bring your insights on Data, Visualization, Innovation or Business Agility to our community. Let them learn from your experience.
Privacy Overview
Get the 3 STEPS
To Drive Analytics Adoption
And manage change
