
The Importance of Probability in Data Science
- by 7wData
The Importance of probability in data science
Why do you need to learn probability in data science?
By Nisha Arya , KDnuggets on February 22, 2023 in Data Science
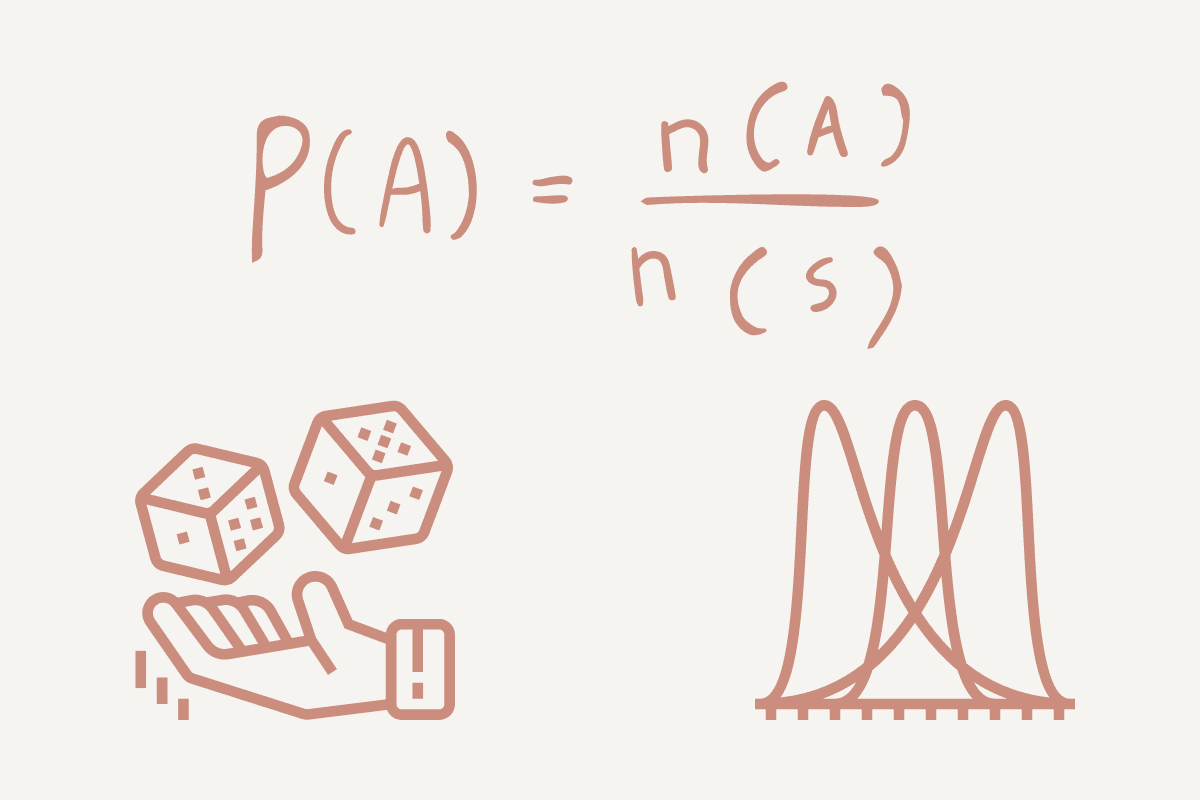
Image by Author
As a Data Scientist, you will want to know the accuracy of your outcomes to ensure validity. The data science workflow is a planned project, with controlled conditions. Allowing you to assess each stage and how it lent towards your output.
What is Probability?
Probability is the measure of the likelihood of an event/something happening. It is an important element in predictive analysis allowing you to explore the computational math behind your outcome.
Using a simple example, let’s look at tossing a coin: either heads (H) or tails (T). Your probability will be the number of ways an event can occur divided by the total number of possible outcomes.
If we want to find the probability of heads, it would be 1 (Head) / 2 (Heads and Tails) = 0.5.
If we want to find the probability of tails, it would be 1 (Tails) / 2 (Heads and Tails) = 0.5.
But we don’t want to get likelihood and probability confused - there is a difference. Probability is the measure of a specific event or outcome occurring. Likelihood is applied when you want to increase the chances of a specific event or outcome occurring.
To break it down - probability is about possible results, whilst likelihood is about hypotheses.
Another term to know is ‘’mutually exclusive events'’. These are events that do not occur at the same time. For example, you cannot go right and left at the same time. Or if we’re flipping a coin, we can either get heads or tails, not both.
Types of Probability
Theoretical Probability: this focuses on how likely an event is to occur and is based on the foundation of reasoning. Using theory, the outcome is the expected value. Using the head and tails example, the theoretical probability of landing on heads is 0.5 or 50%.
Experimental Probability: this focuses on how frequently an event occurs during an experiment duration. Using the head and tails example - if we were to toss a coin 10 times and it landed on heads 6 times, the experimental probability of the coin landing on heads would be 6/10 or 60%.
Conditional probability
Conditional probability is the possibility of an event/outcome occurring based on an existing event/outcome. For example, if you’re working for an insurance company, you may want to find the probability of a person being able to pay for his insurance based on the condition that they have taken out a house loan.
Conditional Probability helps Data Scientists produce more accurate models and outputs by using other variables in the dataset.
Distribution
A probability distribution is a statistical function that helps to describe the possible values and probabilities for a random variable within a given range. The range will have possible minimum and maximum values, and where they are plotted on a distribution graph depend on statistical tests.
Depending on the type of data used in the project, you can figure out what type of distribution you are using. I will break them down into two categories: discrete distribution and continuous distribution.
Discrete Distribution
Discrete distribution is when the data can only take on certain values or has a limited number of outcomes. For example, if you were to roll a die, your limited values are 1, 2, 3, 4, 5, and 6.
There are different types of discrete distribution. For example:
Discrete uniform distribution is when all the outcomes are equally likely. If we use the example of rolling a six-sided die, there is an equal probability that it can land on 1, 2, 3, 4, 5, or 6 - ⅙.
[Social9_Share class=”s9-widget-wrapper”]
Upcoming Events
Evolving Your Data Architecture for Trustworthy Generative AI
18 April 2024
5 PM CET – 6 PM CET
Read MoreShift Difficult Problems Left with Graph Analysis on Streaming Data
29 April 2024
12 PM ET – 1 PM ET
Read More
